Below an up-to-date list of echocardiographic normal values.
Left Ventricle
Left Ventricular Systolic Function
Reference limits and values and partition values of left ventricular function[1]
|
|
Women |
Men
|
| Reference range
|
Mildly abnormal
|
Moderately abnormal
|
Severely abnormal
|
Reference range
|
Mildly abnormal
|
Moderately abnormal
|
Severely abnormal
|
| Linear method
|
| Endocardial fractional shortening, %
|
27–45
|
22–26
|
17–21
|
≤16
|
25–43
|
20–24
|
15–19
|
≤14
|
| Midwall fractional shortening, %
|
15–23
|
13–14
|
11–12
|
≤10
|
14–22
|
12–13
|
10–11
|
≤10
|
| 2D Method
|
| Ejection fraction, %
|
≥55
|
45–54
|
30–44
|
<30
|
≥55
|
45–54
|
30–44
|
<30
|
- 2D, Two-dimensional.
- Green values: Recommended and best validated.
|
Left Ventricular Diastolic Function
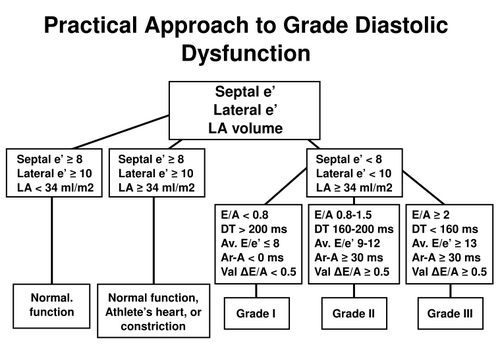
Practical approach to LV diastolic function grading. Ater
ASEDF
Normal values for Doppler-derived diastolic measurementsASEDF
|
|
Age group (y)
|
| Measurement
|
16-20
|
21-40
|
41-60
|
>60
|
| IVRT (ms)
|
50 ± 9 (32-68)
|
67 ± 8 (51-83)
|
74 ± 7 (60-88)
|
87 ± 7 (73-101)
|
| E/A ratio
|
1.88 ± 0.45 (0.98-2.78)
|
1.53 ± 0.40 (0.73-2.33)
|
1.28 ± 0.25 (0.78-1.78)
|
0.96 ± 0.18 (0.6-1.32)
|
| DT (ms)
|
142 ± 19 (104-180)
|
166 ± 14 (138-194)
|
181 ± 19 (143-219)
|
200 ± 29 (142-258)
|
| A duration (ms)
|
113 ± 17 (79-147)
|
127 ± 13 (101-153)
|
133 ± 13 (107-159)
|
138 ± 19 (100-176)
|
| PV S/D ratio
|
0.82 ± 0.18 (0.46-1.18)
|
0.98 ± 0.32 (0.34-1.62)
|
1.21 ± 0.2 (0.81-1.61)
|
1.39 ± 0.47 (0.45-2.33)
|
| PV Ar (cm/s)
|
16 ± 10 (1-36)
|
21 ± 8 (5-37)
|
23 ± 3 (17-29)
|
25 ± 9 (11-39)
|
| PV Ar duration (ms)
|
66 ± 39 (1-144)
|
96 ± 33 (30-162)
|
112 ± 15 (82-142)
|
113 ± 30 (53-173)
|
| Septal e´ (cm/s)
|
14.9 ± 2.4 (10.1-19.7)
|
15.5 ± 2.7 (10.1-20.9)
|
12.2 ± 2.3 (7.6-16.8)
|
10.4 ± 2.1 (6.2-14.6)
|
| Septal e´/a´ ratio
|
2.4∗
|
1.6 ± 0.5 (0.6-2.6)
|
1.1 ± 0.3 (0.5-1.7)
|
0.85 ± 0.2 (0.45-1.25)
|
| Lateral e´ (cm/s)
|
20.6 ± 3.8 (13-28.2)
|
19.8 ± 2.9 (14-25.6)
|
16.1 ± 2.3 (11.5-20.7)
|
12.9 ± 3.5 (5.9-19.9)
|
| Lateral e´/a´ ratio
|
3.1∗
|
1.9 ± 0.6 (0.7-3.1)
|
1.5 ± 0.5 (0.5-2.5)
|
0.9 ± 0.4 (0.1-1.7)
|
- Data are expressed as mean ± SD (95% confidence interval). Note that for e´ velocity in subjects aged 16 to 20 years, values overlap with those for subjects aged 21 to 40 years. This is because e´ increases progressively with age in children and adolescents. Therefore, the e´ velocity is higher in a normal 20-year-old than in a normal 16-year-old, which results in a somewhat lower average e´ value when subjects aged 16 to 20 years are considered.
- ∗ Standard deviations are not included because these data were computed, not directly provided in the original articles from which they were derived.
|
Left Ventricular Mass and Geometry
Reference limits and partition values of left ventricular mass and geometryASE
|
|
Women |
Men
|
Reference
range
|
Mildly
abnormal
|
Moderately
abnormal
|
Severely
abnormal
|
Reference
range
|
Mildly
abnormal
|
Moderately
abnormal
|
Severely
abnormal
|
| Linear Method
|
| LV mass, g
|
67–162
|
163–186
|
187–210
|
≥211
|
88–224
|
225–258
|
259–292
|
≥293
|
| LV mass/BSA, g/m2
|
43–95
|
96–108
|
109–121
|
≥122
|
49–115
|
116–131
|
132–148
|
≥149
|
| LV mass/height, g/m
|
41–99
|
100–115
|
116–128
|
≥129
|
52–126
|
127–144
|
145–162
|
≥163
|
| LV mass/height2, g/m2
|
18–44
|
45–51
|
52–58
|
≥59
|
20–48
|
49–55
|
56–63
|
≥64
|
| Relative wall thickness, cm
|
0.22–0.42
|
0.43–0.47
|
0.48–0.52
|
≥0.53
|
0.24–0.42
|
0.43–0.46
|
0.47–0.51
|
≥0.52
|
| Septal thickness, cm
|
0.6–0.9
|
1.0–1.2
|
1.3–1.5
|
≥1.6
|
0.6–1.0
|
1.1–1.3
|
1.4–1.6
|
≥1.7
|
| Posterior wall thickness, cm
|
0.6–0.9
|
1.0–1.2
|
1.3–1.5
|
≥1.6
|
0.6–1.0
|
1.1–1.3
|
1.4–1.6
|
≥1.7
|
| 2D Method
|
| LV mass, g
|
66–150
|
151–171
|
172–182
|
>193
|
96–200
|
201–227
|
228–254
|
>255
|
| LV mass/BSA, g/m2
|
44–88
|
89–100
|
101–112
|
≥113
|
50–102
|
103–116
|
117–130
|
≥131
|
- BSA, Body surface area; LV, left ventricular; 2D, 2-dimensional.
- Green values: Recommended and best validated.
|
Left Ventricular Size
Reference limits and partition values of left ventricular sizeASE
|
|
Women |
Men
|
Reference
range
|
Mildly
abnormal
|
Moderately
abnormal
|
Severely
abnormal
|
Reference
range
|
Mildly
abnormal
|
Moderately
abnormal
|
Severely
abnormal
|
| LV dimension
|
| LV diastolic diameter |
3.9–5.3 |
5.4–5.7 |
5.8–6.1 |
≥6.2 |
4.2–5.9 |
6.0–6.3 |
6.4–6.8 |
≥6.9
|
| LV diastolic diameter/BSA, cm/m2
|
2.4–3.2
|
3.3–3.4
|
3.5–3.7
|
≥3.8
|
2.2–3.1
|
3.2–3.4
|
3.5–3.6
|
≥3.7
|
| LV diastolic diameter/height, cm/m
|
2.5–3.2
|
3.3–3.4
|
3.5–3.6
|
≥3.7
|
2.4–3.3
|
3.4–3.5
|
3.6–3.7
|
≥3.8
|
| LV volume
|
| LV diastolic volume, mL
|
56–104
|
105–117
|
118–130
|
≥131
|
67–155
|
156–178
|
179–201
|
≥201
|
| LV diastolic volume/BSA, mL/m2
|
35–75
|
76–86
|
87–96
|
≥97
|
35–75
|
76–86
|
87–96
|
≥97
|
| LV systolic volume, mL
|
19–49
|
50–59
|
60–69
|
≥70
|
22–58
|
59–70
|
71–82
|
≥83
|
| LV systolic volume/BSA, mL/m2
|
12–30
|
31–36
|
37–42
|
≥43
|
12–30
|
31–36
|
37–42
|
≥43
|
- BSA, body surface area; LV, left ventricular.
- Green values: Recommended and best validated.
|
Right Ventricle
Right Ventricular and Pulmonary Artery Size
Reference limits and partition values of right ventricular and pulmonary artery sizeASE
|
|
Reference range
|
Mildly abnormal
|
Moderately abnormal
|
Severely abnormal
|
| RV dimensions
|
| Basal RV diameter (RVD 1), cm
|
2.0–2.8
|
2.9-3.3
|
3.4–3.8
|
≥3.9
|
| Mid-RV diameter (RVD 2), cm
|
2.7–3.3
|
3.4–3.7
|
3.8–4.1
|
≥4.2
|
| Base-to-apex length (RVD 3), cm
|
7.1–7.9
|
8.0–8.5
|
8.6–9.1
|
≥9.2
|
| RVOT diameters
|
| Above aortic valve (RVOT 1), cm
|
2.5–2.9
|
3.0–3.2
|
3.3–3.5
|
≥3.6
|
| Above pulmonic valve (RVOT 2), cm
|
1.7–2.3
|
2.4–2.7
|
2.8–3.1
|
≥3.2
|
| PA diameter
|
| Below pulmonic valve (PA 1), cm
|
1.5–2.1
|
2.2–2.5
|
2.6–2.9
|
≥3.0
|
- RV, Right ventricular; RVOT, right ventricular outflow tract; PA, pulmonary artery.
- Data from Foale et al.Foale
|
Right Ventricular Size and Function
Reference limits and partition values of right ventricular size and function as measured in the apical 4-chamber viewASE
|
|
Reference range
|
Mildly abnormal
|
Moderately abnormal
|
Severely abnormal
|
| RV diastolic area, cm2
|
11–28
|
29–32
|
33–37
|
≥38
|
| RV systolic area, cm2
|
7.5–16
|
17–19
|
20–22
|
≥23
|
| RV fractional area change, %
|
32–60
|
25–31
|
18–24
|
≤17
|
| TAPSE, (cm)
|
1.5-2.0ASE
|
1.3-1.5Hamer
|
1.0-1.2Hamer
|
<1.0Hamer
|
- RV, Right ventricular.
- Data from Weyman.Weyman
|
Atria
Left Atrial Dimensions / Volumes
Reference limits and partition values for left atrial dimensions/volumesASE
|
|
Women
|
Men
|
| Reference range
|
Mildly abnormal
|
Moderately abnormal
|
Severely abnormal
|
Reference range
|
Mildly abnormal
|
Moderately abnormal
|
Severely abnormal
|
| Atrial dimensions
|
| LA diameter, cm
|
2.7–3.8
|
3.9–4.2
|
4.3–4.6
|
≥4.7
|
3.0–4.0
|
4.1–4.6
|
4.7–5.2
|
≥5.2
|
| LA diameter/BSA, cm/m2
|
1.5–2.3
|
2.4–2.6
|
2.7–2.9
|
≥3.0
|
1.5–2.3
|
2.4–2.6
|
2.7–2.9
|
≥3.0
|
| RA minor-axis dimension, cm
|
2.9–4.5
|
4.6–4.9
|
5.0–5.4
|
≥5.5
|
2.9–4.5
|
4.6–4.9
|
5.0–5.4
|
≥5.5
|
| RA minor-axis dimension/BSA, cm/m2
|
1.7–2.5
|
2.6–2.8
|
2.9–3.1
|
≥3.2
|
1.7–2.5
|
2.6–2.8
|
2.9–3.1
|
≥3.2
|
| Atrial area
|
| LA area, cm2
|
≤20
|
20–30
|
30–40
|
>40
|
≤20
|
20–30
|
30–40
|
>40
|
| Atrial volumes
|
| LA volume, mL
|
22–52
|
53–62
|
63–72
|
≥73
|
18–58
|
59–68
|
69–78
|
≥79
|
| LA volume/BSA, mL/m2
|
22 ± 6
|
29–33
|
34–39
|
≥40
|
22 ± 6
|
34-42
|
42-48
|
≥48
|
- BSA, Body surface area; LA, left atrial; RA, right atrial.
- Green values: Recommended and best validated.
|
Left Atrial Pressure
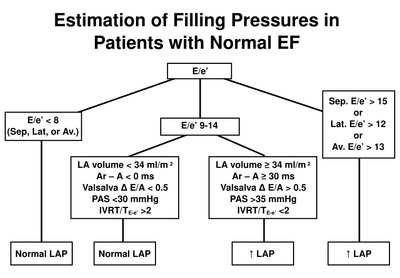
Estimation of left atrial pressure in normal LVEF. After
ASEDF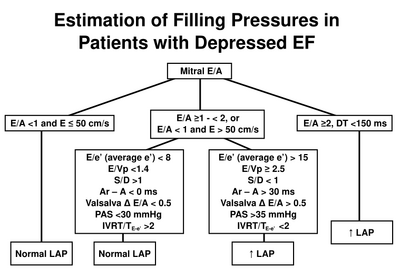
Estimation of left atrial pressure in reduced LVEF. After
ASEDF
Aortic Valve
Aortic valve stenosis - severity
Recommendations for classification of AS severityASEVS
|
|
Aortic sclerosis
|
Mild
|
Moderate
|
Severe
|
| Aortic jet velocity (m/s)
|
≤2.5 m/s
|
2.6-2.9
|
3.0-4.0
|
>4.0
|
| Mean gradient (mmHg)
|
-
|
<20 (<30a)
|
20-40b (30-50a)
|
>40b (>50a)
|
| AVA (cm2)
|
-
|
>1.5
|
1.0-1.5
|
<1
|
| Indexed AVA (cm2/m2)
|
|
>0.85
|
0.60-0.85
|
<0.6
|
| Velocity ratio
|
|
>0.50
|
0.25-0.50
|
<0.25
|
- aESC Guidelines.ESCAS
- bAHA/ACC Guidelines.AHAAS
|
Aortic regurgitation - severity
Application of specific and supportive signs, and quantitative parameters in the grading of aortic regurgitation severityASERE
|
|
Mild
|
Moderate
|
Severe
|
| Specific signs for AR severity
|
- Central Jet, width < 25% of LVOTς
- Vena contracta < 0.3 cmς
- No or brief early diastolic flow reversal in descending aorta
|
- Signs of AR>mild present but no criteria for severe AR
|
- Central Jet, width ≥ 65% of LVOTς
- Vena contracta > 0.6cmς
|
| Supportive signs
|
- Pressure half-time > 500 ms
- Normal LV size∗
|
|
- Pressure half-time < 200 ms
- Holodiastolic aortic flow reversal in descending aorta
- Moderate or greater LV enlargement∗∗
|
| Quantitative parametersψ
|
| R Vol, ml/beat
|
< 30
|
30-44
|
45-59
|
≥ 60
|
| RF %
|
< 30
|
30-39
|
40-49
|
≥ 50
|
| EROA, cm2
|
< 0.10
|
0.10-0.19
|
0.20-0.29
|
≥ 0.30
|
- AR, Aortic regurgitation; EROA, effective regurgitant orifice area; LV, left ventricle; LVOT, left ventricular outflow tract; R Vol, regurgitant volume; RF, regurgitant fraction.
- ∗ LV size applied only to chronic lesions. Normal 2D measurements: LV minor-axis ≤ 2.8 cm/m2, LV end-diastolic volume ≤ 82 ml/m2 (2).
- ς At a Nyquist limit of 50–60 cm/s.
- ∗∗ In the absence of other etiologies of LV dilatation.
- ψ Quantitative parameters can help sub-classify the moderate regurgitation group into mild-to-moderate and moderate-to-severe regurgitation as shown.
|
Mitral Valve
Mitral regurgitation - severity
Application of specific and supportive signs, and quantitative parameters in the grading of mitral regurgitation severityASERE
|
|
Mild
|
Moderate
|
Severe
|
| Specific signs of severity
|
- Small central jet <4 cm2 or <20% of LA areaψ
- Vena contracta width <0.3 cm
- No or minimal flow convergence
|
- Signs of MR>mild present, but no criteria for severe MR
|
- Vena contracta width ≥ 0.7cm with large central MR jet (area < 40% of LA) or with a wall-impinging jet of any size, swirling in LAψ
- Large flow convergenceς
- Systolic reversal in pulmonary veins
- Prominent flail MV leaflet or ruptured papillary muscle
|
| Supportive signs
|
- Systolic dominant flow in pulmonary veins
- A-wave dominant mitral inflowΦ
- Soft density, parabolic CW Doppler MR signal
- Normal LV size∗
|
- Intermediate signs/findings
|
- Dense, triangular CW Doppler MR jet
- E-wave dominant mitral inflow (E >1.2 m/s)Φ Enlarged LV and LA size∗∗, (particularly when normal LV function is present).
|
| Quantitative parametersφ
|
| R Vol (ml/beat)
|
< 30
|
30-44
|
45-59
|
≥ 60
|
| RF (%)
|
< 30
|
30-39
|
40-49
|
≥ 50
|
| EROA (cm2)
|
< 0.20
|
0.20-0.29
|
0.30-0.39
|
≥ 0.40
|
- CW, Continuous wave; EROA, effective regurgitant orifice area; LA, left atrium; LV, left ventricle; MV, mitral valve; MR, mitral regurgitation; R Vol, regurgitant volume; RF, regurgitant fraction.
- ∗ LV size applied only to chronic lesions. Normal 2D measurements: LV minor axis ≤ 2.8 cm/m2, LV end-diastolic volume ≤ 82 ml/m2, maximal LA antero-posterior diameter ≤ 2.8 cm/m2, maximal LA volume ≤ 36 ml/m2 (2;33;35).
- ∗∗ In the absence of other etiologies of LV and LA dilatation and acute MR.
- ψ At a Nyquist limit of 50-60 cm/s.
- Φ Usually above 50 years of age or in conditions of impaired relaxation, in the absence of mitral stenosis or other causes of elevated LA pressure.
- ς Minimal and large flow convergence defined as a flow convergence radius < 0.4 cm and ≤ 0.9 cm for central jets, respectively, with a baseline shift at a Nyquist of 40 cm/s; Cut-offs for eccentric jets are higher, and should be angle corrected (see text).
- φ Quantitative parameters can help sub-classify the moderate regurgitation group into mild-to-moderate and moderate-to-severe as shown.
|
Mitral stenosis - severity
Recommendations for classification of mitral stenosis severityASEVS
|
|
Mild
|
Moderate
|
Severe
|
| Specific findings
|
| Valve area (cm2)
|
>1.5
|
1.0-1.5
|
<1.0
|
| Supportive findings
|
| Mean gradient (mmHg)a
|
<5
|
5-10
|
>10
|
| Pulmonary artery pressure (mmHg)
|
<30
|
30-50
|
>50
|
- aAt heart rates between 60 and 80 bpm and in sinus rhythm.
|
Mitral valve stenosis - Wilkins score
Assessment of mitral valve anatomy according to the Wilkins scoreWilkins
| Grade
|
Mobility
|
Thickening
|
Calcification
|
Subvalvular Thickening
|
| 1
|
Highly mobile valve with only leaflet tips restricted
|
Leaflets near normal in thickness (4-5 mm)
|
A single area of increased echo brightness
|
Minimal thickening just below the mitral leaflets
|
| 2
|
Leaflet mid and base portions have normal mobility
|
Midleaflets normal, considerable thickening of margins (5-8 mm)
|
Scattered areas of brightness confined to leaflet margins
|
Thickening of chordal structures extending to one-third of the chordal length
|
| 3
|
Valve continues to move forward in diastole, mainly from the base
|
Thickening extending through the entire leaflet (5-8mm)
|
Brightness extending into the mid-portions of the leaflets
|
Thickening extended to distal third of the chords
|
| 4
|
No or minimal forward movement of the leaflets in diastole
|
Considerable thickening of all leaflet tissue (>8-10mm)
|
Extensive brightness throughout much of the leaflet tissue
|
Extensive thickening and shortening of all chordal structures extending down to the papillary muscles
|
- The total score is the sum of the four items and ranges between 4 and 16.
|
Mitral stenosis - routine measurements
Recommendations for data recording and measurement in routine use for mitral stenosis quantitationASEVS
| Data element
|
Recording
|
Measurement
|
| Planimetry
|
| - 2D parasternal short-axis view
|
- contour of the inner mitral orifice
|
| - determine the smallest orifice by scanning from apex to base
|
- include commissures when opened
|
| - positioning of measurement plan can be oriented by 3D echo
|
- in mid-diastole (use cine-loop)
|
| - lowest gain setting to visualize the whole mitral orifice
|
- average measurements if atrial fibrillation
|
| Mitral flow
|
| - continuous-wave Doppler
|
- mean gradient from the traced contour of the diastolic mitral flow
|
| - apical windows often suitable (optimize intercept angle)
|
- pressure half-time from the descending sLope of the E-wave (mid-diastole slope if not linear)
|
| - adjust gain setting to obtain well-defined flow contour
|
- average measurements if atrial fibrillation
|
| Systolic pulmonary artery pressure
|
| - continuous-wave Doppler
|
- maximum velocity of tricuspid regurgitant flow
|
| - multiple acoustic windows to optimize intercept angle
|
- estimation of right atrial pressure according to inferior vena cava diameter
|
| Valve anatomy
|
|
- parasternal short-axis view
|
|
- valve thickness (maximum and heterogeneity)
- commissural fusion
- extension and location of localized bright zones (fibrous nodutes or calcification)
|
|
- parasternal long-axis view
|
|
- valve thickness
- extension of calcification
- valve pliability
- subvalvular apparatus (chordal thickening, fusion, or shortening)
|
| - apical two-chamber view
|
- subvalvular apparatus (chordal thickening, fusion, or shortening)
|
|
Detail each component and summarize in a score
|
Tricuspid Valve
Tricuspid regurgitation - severity
Echocardiographic and Doppler parameters used in grading tricuspid regurgitation severityASERE
| Parameter
|
Mild
|
Moderate
|
Severe
|
| Tricuspid valve
|
Usually normal
|
Normal or abnormal
|
Abnormal/Flail leaflet/Poor coaptation
|
| RV/RA/IVC size
|
Normal∗
|
Normal or dilated
|
Usually dilated∗∗
|
| Jet area-central jets (cm2)§
|
< 5
|
5-10
|
> 10
|
| VC width (cm)Φ
|
Not defined
|
Not defined, but < 0.7
|
> 0.7
|
| PISA radius (cm)ψ
|
≤ 0.5
|
0.6-0.9
|
> 0.9
|
| Jet density and contour–CW
|
Soft and parabolic
|
Dense, variable contour
|
Dense, triangular with early peaking
|
| Hepatic vein flow†
|
Systolic dominance
|
Systolic blunting
|
Systolic reversal
|
- CW, Continuous wave Doppler; IVC, inferior vena cava; RA, right atrium; RV, right ventricle; VC, vena contracta width.
- ∗ Unless there are other reasons for RA or RV dilation. Normal 2D measurements from the apical 4-chamber view: RV medio-lateral end-diastolic dimension ≤ 4.3 cm, RV end-diastolic area ≤ 35.5 cm2, maximal RA medio-lateral and supero-inferior dimensions ≤ 4.6 cm and 4.9 cm respectively, maximal RA volume ≤ 33 ml/m2(35;89).
- ∗∗ Exception: acute TR.
- § At a Nyquist limit of 50-60 cm/s. Not valid in eccentric jets. Jet area is not recommended as the sole parameter of TR severity due to its dependence on
hemodynamic and technical factors.
- Φ At a Nyquist limit of 50-60 cm/s.
- ψ Baseline shift with Nyquist limit of 28 cm/s.
- † Other conditions may cause systolic blunting (eg. atrial fibrillation, elevated RA pressure).
|
Tricuspid stenosis - severity
Findings indicative of haemodynamically significant tricuspid stenosisASEVS
| Specific findings
|
| Mean pressure gradient
|
≥5 mmHg
|
| Inflow time-velocity integral
|
>60 cm
|
| T1/2
|
≥190 ms
|
| Valve area by continuity equationa
|
≤1 cm2
|
| Supportive findings
|
| Enlarged right atrium ≥moderate
|
|
| Dilated inferior vena cava
|
|
- aStroke volume derived from left or right ventricular outflow. In the presence of more than mild TR, the derived valve area will be underestimated. Nevertheless, a value ≤1 cm2 implies a significant haemodynamic burden imposed by the combined lesion.
|
Pulmonary Valve
Pulmonary regurgitation - severity
Echocardiographic and Doppler parameters used in grading pulmonary regurgitation severityASERE
| Parameter
|
Mild
|
Moderate
|
Severe
|
| Pulmonic valve
|
Normal
|
Normal or abnormal
|
Abnormal
|
| RV size
|
Normal∗
|
Normal or dilated
|
Dilated
|
| Jet size by color Doppler§
|
Thin (usually < 10 mm in length) with a narrow origin
|
Intermediate
|
Usually large, with a wide origin; May be brief in duration
|
| Jet density and deceleration rate –CW†
|
Soft; Slow deceleration
|
Dense; variable deceleration
|
Dense; steep deceleration, early termination of diastolic flow
|
| Pulmonic systolic flow compared to systemic flow –PWφ
|
Slightly increased
|
Intermediate
|
Greatly increased
|
- CW, Continuous wave Doppler; PR, pulmonic regurgitation; PW, pulsed wave Doppler; RA, right atrium; RF, regurgitant fraction; RV, right ventricle.
- ∗ Unless there are other reasons for RV enlargement. Normal 2D measurements from the apical 4-chamber view; RV medio-lateral end-diastolic dimension ≤ 4.3 cm, RV end-diastolic area ≤ 35.5 cm2(89).
- ∗∗ Exception: acute PR
- § At a Nyquist limit of 50-60 cm/s.
- φ Cut-off values for regurgitant volume and fraction are not well validated.
- † Steep deceleration is not specific for severe PR.
|
Pulmonary stenosis - severity
Grading of pulmonary stenosisASEVS
|
|
Mild
|
Moderate
|
Severe
|
| Peak velocity (m/s)
|
<3
|
3-4
|
>4
|
| Peak gradient (mmHg)
|
<36
|
36-64
|
>64
|
Inferior Caval Vein
Estimate of central veinous pressure using ICV echo
| CVP
|
IVC collaps on inspiration
|
IVC diameter
|
| CVP 0-5 cm
|
total collaps
|
< 1.5 cm
|
| CVP 5-10 cm
|
>50%
|
1.5 to 2.5 cm
|
| CVP 11-15 cm
|
<50%
|
1.5 to 2.5 cm
|
| CVP 16-20 cm
|
<50%
|
> 2.5 cm
|
| CVP > 20 cm
|
no change
|
> 2.5 cm
|
References
Click on the reference to link directly to the manuscript
<biblio>
- Foale pmid=3730205
- Weyman isbn=0812112075
- ASE pmid=16458610
- ASEVS pmid=19130998
- Wilkins pmid=3190958
- ESCAS pmid=17259184
- ACCAS pmid=18848134
- ASERE pmid=12835667
- ASEDF pmid=19187853
- Hamer isbn=9031362352
</biblio>
External links


